Can the S&P 500 Predict the Presidential Winner?

I recently saw some stats on using the S&P 500 to predict the winner of the presidential election and I thought they were interesting enough for a newsletter. Below is a chart that calculates the returns for the three months leading up to every presidential election going back to 1980 to see if there was a correlation between returns and who won the election. Let’s look at the numbers.
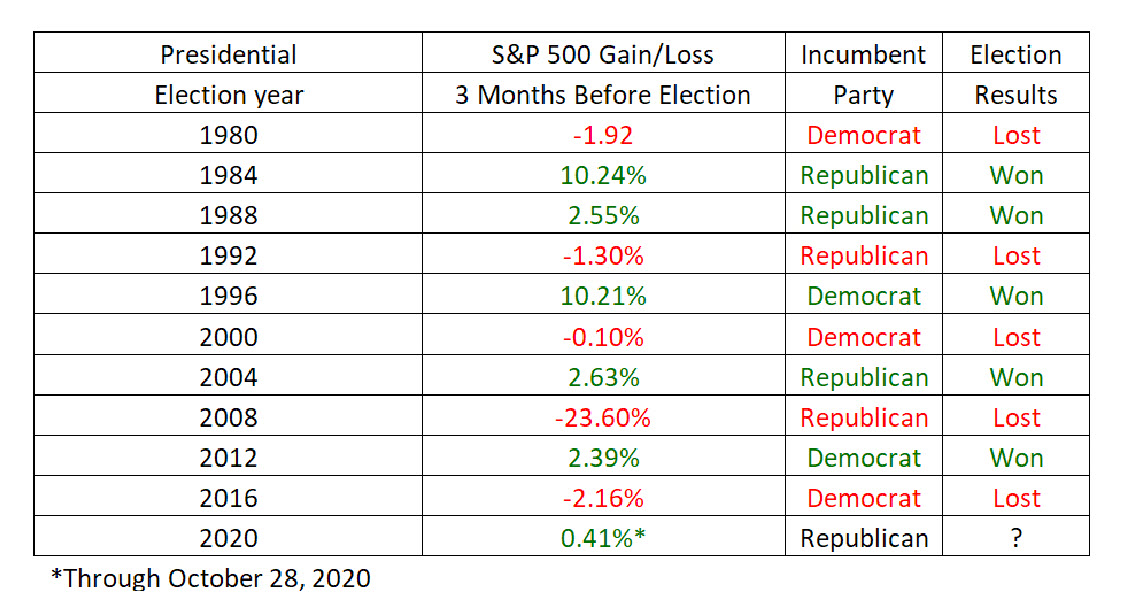
Interesting isn’t it? Every election in the last 40 years was predicted by the 3-month returns leading up to the election. Does that mean Trump will win if the market doesn’t tank before election day? This chart would say yes and as you know, “it’s the economy stupid” as they say.
Stock Market Returns for 12 Months After a Presidential Election
A lot of people (advisors and consumers) are worried about what will happen to the stock market after the election. Many think the stock market will tank if Biden wins and will roar ahead if Trump wins. I went back over the same time frame and calculated the S&P 500 returns in the first year of each new presidency.
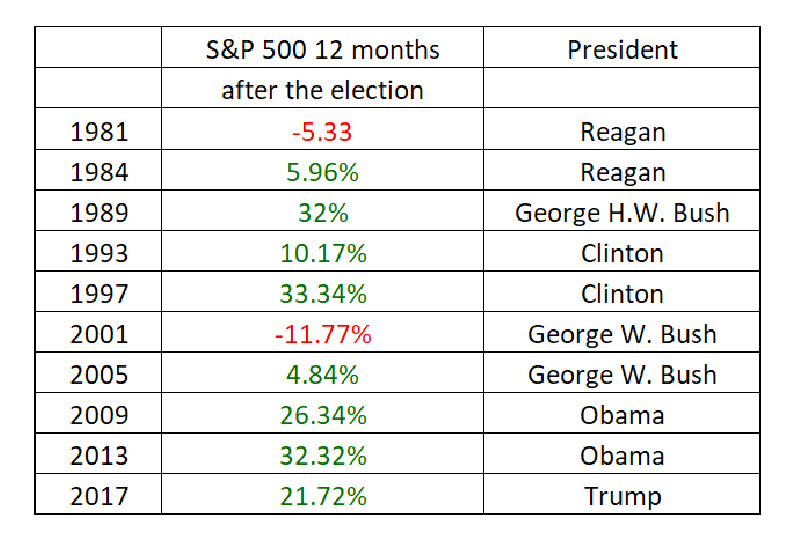
What do you notice from the above chart? 8 out of 10 times the stock market was not only positive, it was very positive. And the average returns for years when democrats are in power = 25.54% and for Republicans = 7.86%. That’s sort of a head scratcher to me, but that data is what it is.
Do the above charts mean that the stock market will be positive or even very positive in 2021? Past performance is no guarantee of future performance, but it’s certainly possible.
Even so, it’s prudent for everyone to make sure they are only taking as much risk as is necessary to reach their investment goals. If you want to discuss how to mitigate risk while growing wealth for retirement, please feel free to email me and I’d be happy to get on the phone for a call.


Big Tax Changes to Know for 2024
Financial Guides2024 has brought some big tax changes with it. It’s essential to stay informed about these...
The Smart Tax Planning Newsletter March 2024
Tax PlanningIn This Issue: IRAs for Young Adults Get Up to $32,220 in Sick and Family Leave Tax Credits New Crypto Tax...
2024 Key Planning & Investment Deadlines for Q2
Financial GuidesSpring is coming and to keep you financially organized for Q2, we are providing you with our Spring...

