Retirement Planning: Securities
Inflation Update February 2023
Joseph Maas, Synergy Asset Management
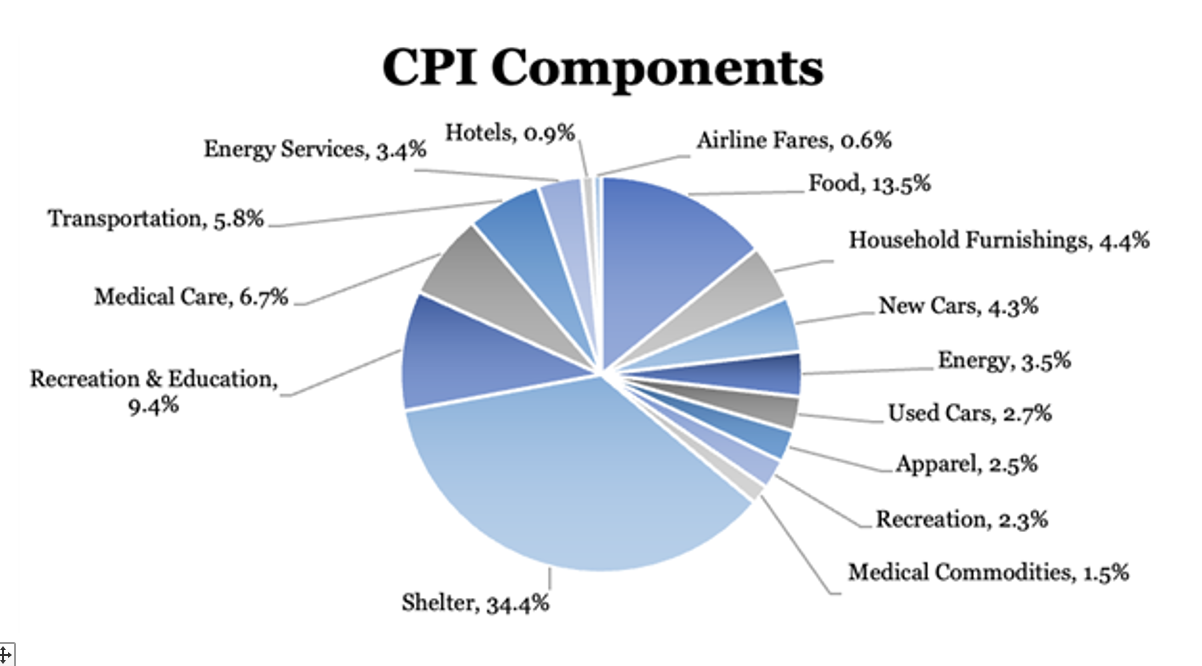
CPI Components
Before diving deeper into what CPI means beyond an increase (or decrease) in prices, it’s important to understand exactly what CPI tracks. The three largest categories, which account for 57.3% of the consumer price index, are shelter (34.4%), food (13.5%), and recreation/education (9.4%). Large swings in one category of the index, especially in the largest components, can weigh heavily on CPI outputs.
Current State of Inflation
Both CPI and PCE inflation for the month of January were recently released. In each measure of inflation, data came in hotter than expected, which has spooked equity markets and increased expectations of likely 50 more basis points of hikes to come in 2023. January’s CPI came in at +6.4% and Core CPI came in at +5.6% year over year. Total CPI came in much higher than expectations and spooked investors. The largest drivers of CPI from January 2022 to January 2023 were airfare (+25.6%), energy services (+15.6%), transportation (+14.6%), and food (+10.1%), while used vehicles posted year over year deflation (-11.6%).
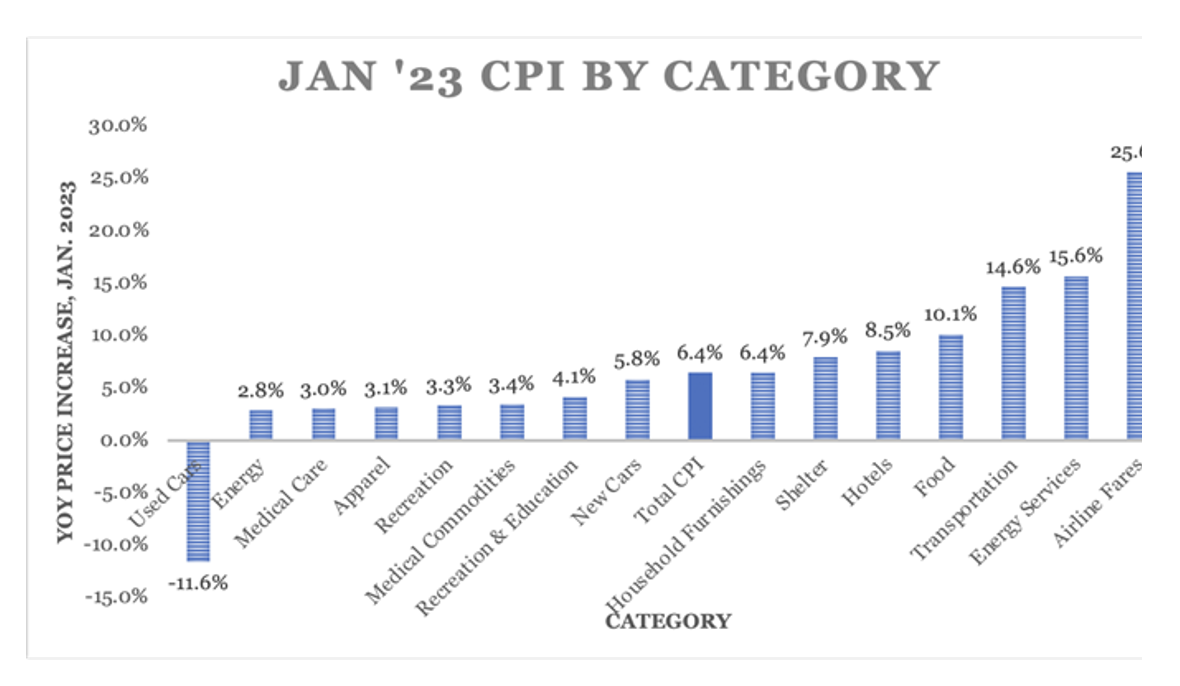
As shown in the chart to the left, CPI weighting and contributions to January year over year inflation are important to note. One key takeaway here is that most categories (airfares, energy services, & transportation) with high, double-digit inflation tend to be weighted less than those with more moderate inflation.
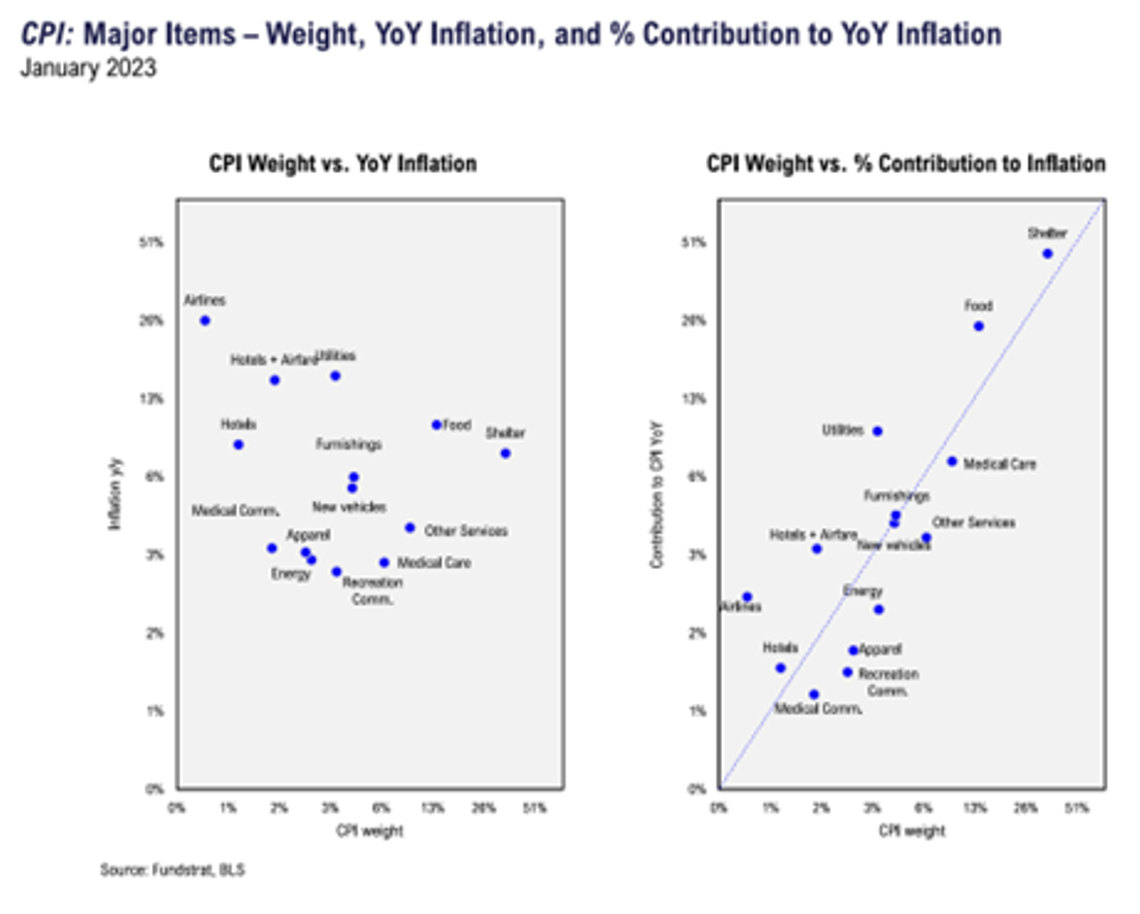
Regardless, none of these categories are on track with the Federal Reserve’s 2% target. Beyond falling significantly short of the Fed’s mandate of price stability, CPI gives us more data than simply knowing prices are increasing.
PCE inflation followed a similar sentiment, coming in much stronger than expected and increasing on a month-over-month basis. January PCE came in at an annual inflation rate of +5.4%, up 10 basis points from December’s +5.3% reading.
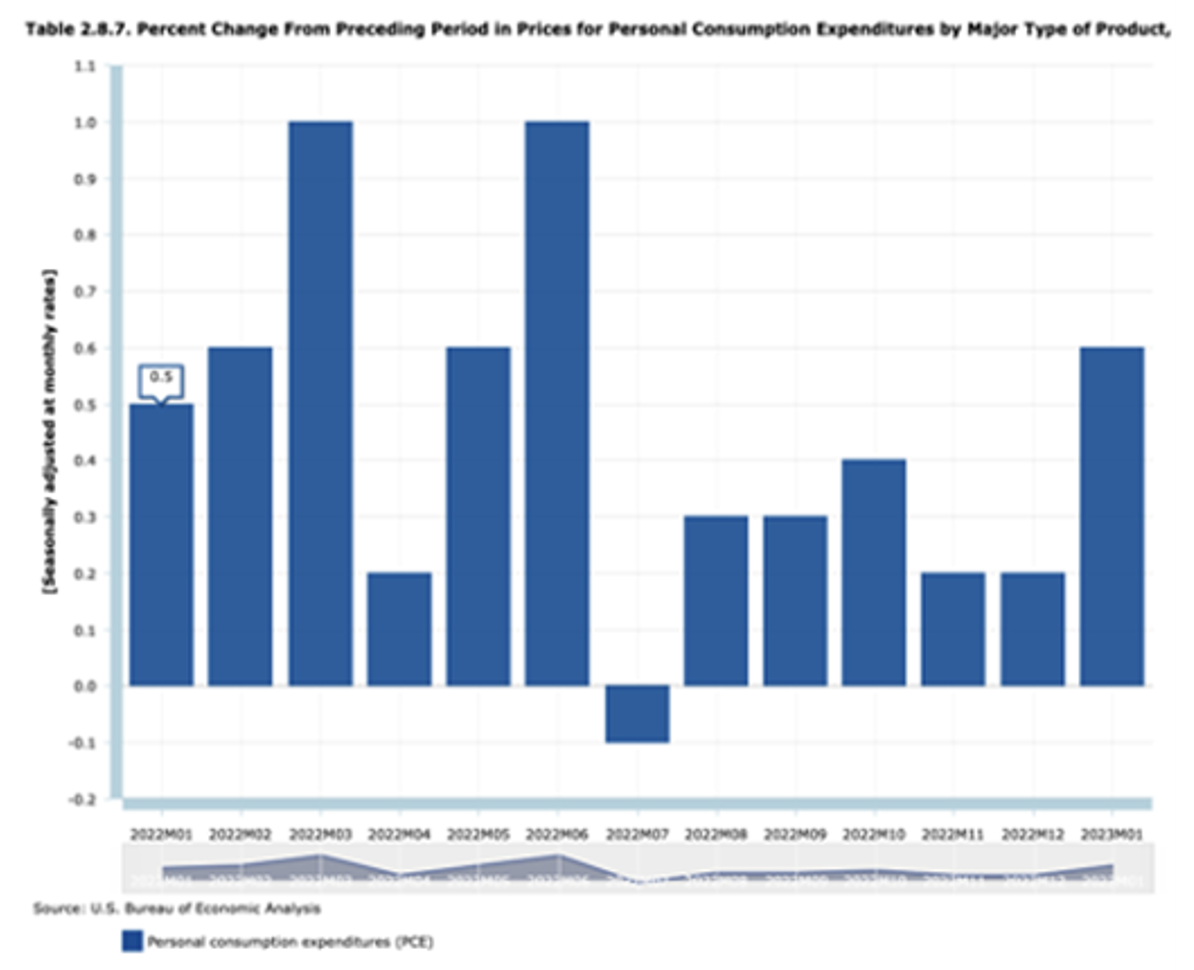
On a month over month basis, both PCE and Core PCE increased a whopping +0.6%, the highest monthly increase in PCE since Summer of 2022.
Inflation Varies Largely by Geography
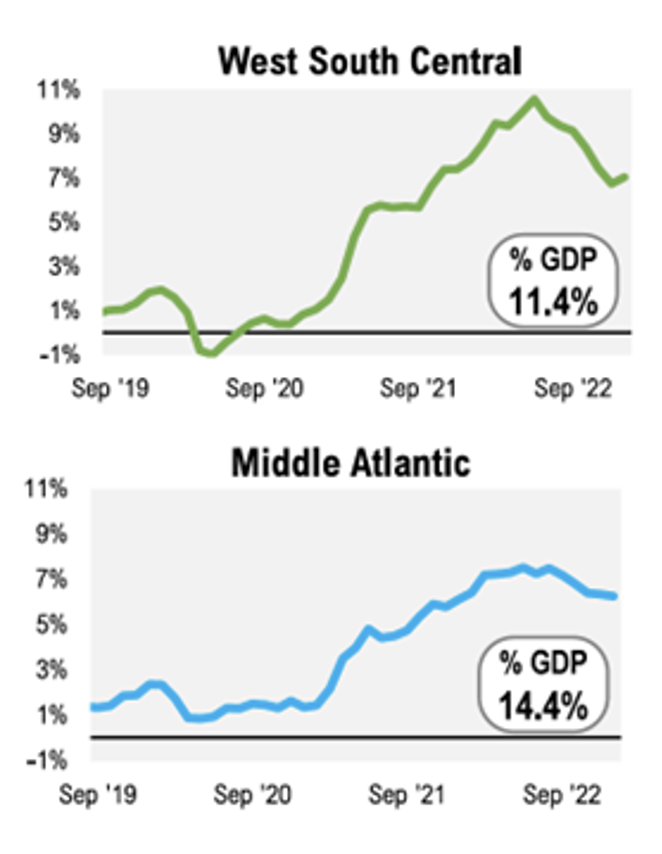
Another insight not all investors realize, is how widely inflation can vary by geography. For a multitude of reasons, different areas of the country faced vastly different inflationary pressure, for example below is the Middle Atlantic region’s CPI chart, along with the West South Central Region’s CPI. Inflation in the Middle Atlantic region was much less substantial than the nearly 11% peak of inflation in the West South Central region. The repercussions of geography range from slimmer corporate earnings for firms headquartered in more inflationary regions, to substantial population shifts out of other inflationary regions, all of which will impact broader inflation trends.
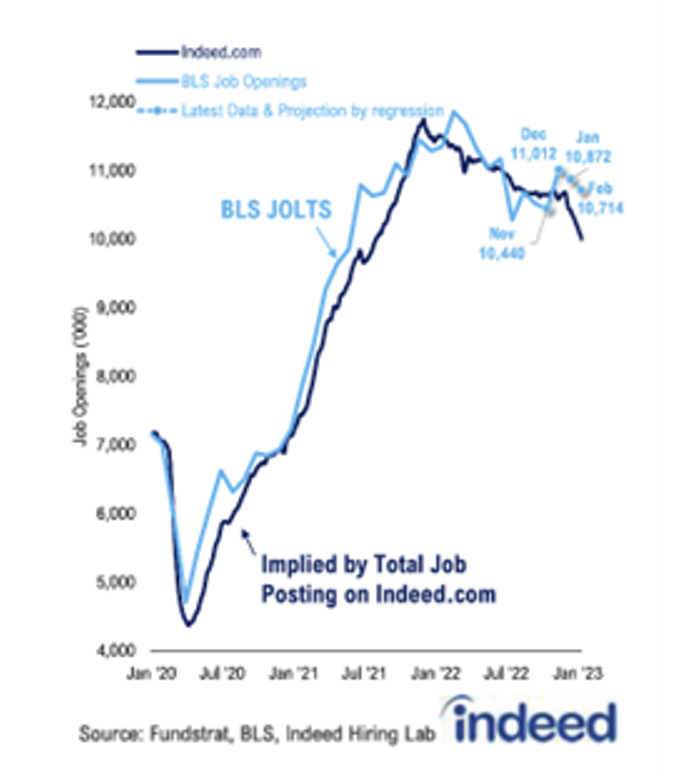
Being one of the largest inputs into inflationary pressures, labor costs and the labor market are essential to monitor to get an idea of inflation. Job openings are a key element of labor markets, as when openings are higher, employers may raise wages to attract employees, also driving up their costs that tend to get passed on to consumers. On the chart to the left, note the recent down trend in job openings from the BLS and Indeed data points.
Since early 2022, job openings have generally moved downward, but are still much higher than pre pandemic levels. As the labor market continues to soften, this will likely be good news in the fight against inflation, from the perspective of input costs to producers that get eventually passed on to consumers.
Home Price Inflation is Dropping Off Quickly
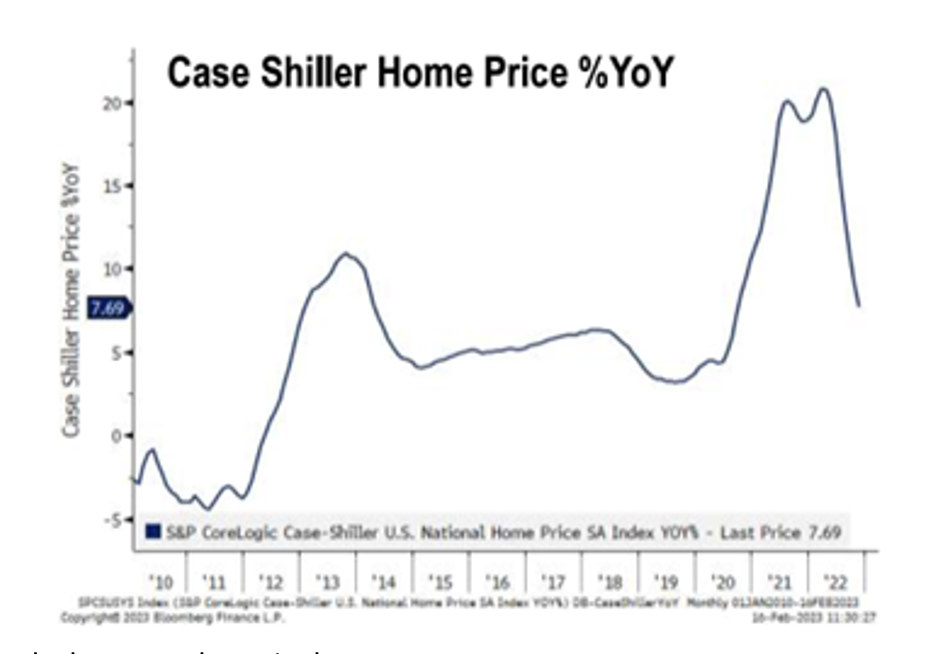
Shelter, being the largest component of CPI is something to watch out for in the fight against inflation. Fortunately, real estate is especially sensitive to interest rate hikes, therefore we have seen a sharp decline in the rate of inflation over the last year, shown in the chart to below. At one point the Case Shiller Home Price Index reached an annual growth rate of over 20%, something that certainly fed into the high inflation of 2022. Now, the index points to mid single digit growth, still much above average, but at a much more manageable level. As the impact of interest rate hikes continue to be priced into the housing market through higher mortgage rates, it is likely the housing market cools off even more and thus helps inflation continue to subside.
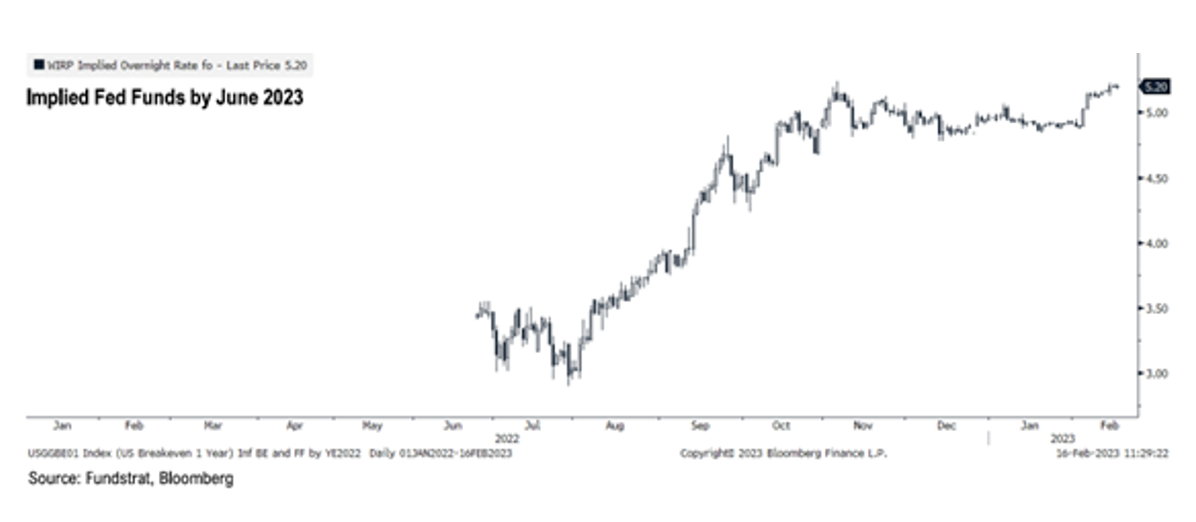
Markets Expect 45 More Basis Points in the Fed Funds Range
Inflationary pressures in 2023 will feel the lagging impact of higher interest rates. Right now, the Federal Funds rate sits at the range of 4.5% to 4.75%, however the market believes the Fed Funds rate to be closer to 5.2% by June this year. As the rippling effects of higher interest rates and as the Fed raises rates by another 25 to 50+ basis points, inflation should come down. The manner and speed in which inflation comes down is unknown, but with such high rates compared to a year ago, logic says inflation must come down one way or another.
Only time will tell the full inflation story of 2023, but considering current inflation, along with inflationary inputs is vital to truly understanding all of the ramifications inflation holds in the current state of the economy.
SERVICES WE OFFER RELATED TO THIS TOPIC
The information contained in this post is for general use and educational purposes only. However, we do offer specific services to our clients to help them implement the strategies mentioned above. For specific information and to determine if these services may be a good fit for you, please select any of the services listed below.
The 4x4 Financial Independence Plan ˢᵐ
Securities
Coaching and Consulting

Big Tax Changes to Know for 2024
Financial Guides2024 has brought some big tax changes with it. It’s essential to stay informed about these...
The Smart Tax Planning Newsletter March 2024
Tax PlanningIn This Issue: IRAs for Young Adults Get Up to $32,220 in Sick and Family Leave Tax Credits New Crypto Tax...
2024 Key Planning & Investment Deadlines for Q2
Financial GuidesSpring is coming and to keep you financially organized for Q2, we are providing you with our Spring...

