Asset Protection
Inflation Update May 2023
Synergy Asset Management, LLC
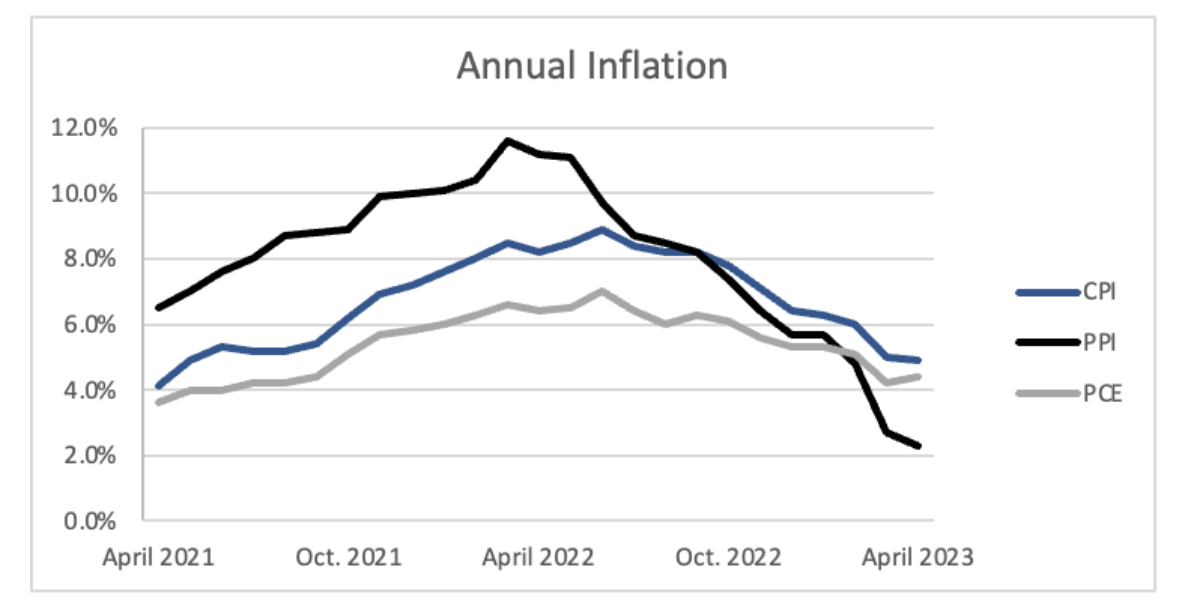
Summary: Consumer-focused measures of inflation, such as CPI and PCE have been trending down but remain elevated, while the Producer Price Index points to a hopeful reality if producers chose to pass on lower inflation. Higher overall inflation is likely to encourage the Federal Reserve to go with another 25 bps rate hike in June.
Comparing Measures of Inflation
Consumer Price Index (CPI)
As the most commonly quoted inflation metric, the consumer price index, or CPI, tracks costs to consumers in urban settings. These costs are based on goods and services weighted by how consumers respond to consumer expenditure surveys.
Producer Price Index (PPI)
A less common metric of inflation, the producer price index is helpful in understanding how costs to producers change and in what categories. PPI is sometimes thought of as a leading indicator of inflation, as costs often get passed down to consumers later on in the forms of CPI and PCE.
Personal Consumption Expenditure (PCE)
Released a few weeks after CPI and PPI, the personal consumption expenditure index tracks costs to consumers in rural and urban areas. This index is based on and weighted by data provided from businesses on what they actually sold to consumers and is favored by the Federal Reserve when considering monetary policy.
Current State of Inflation
CPI
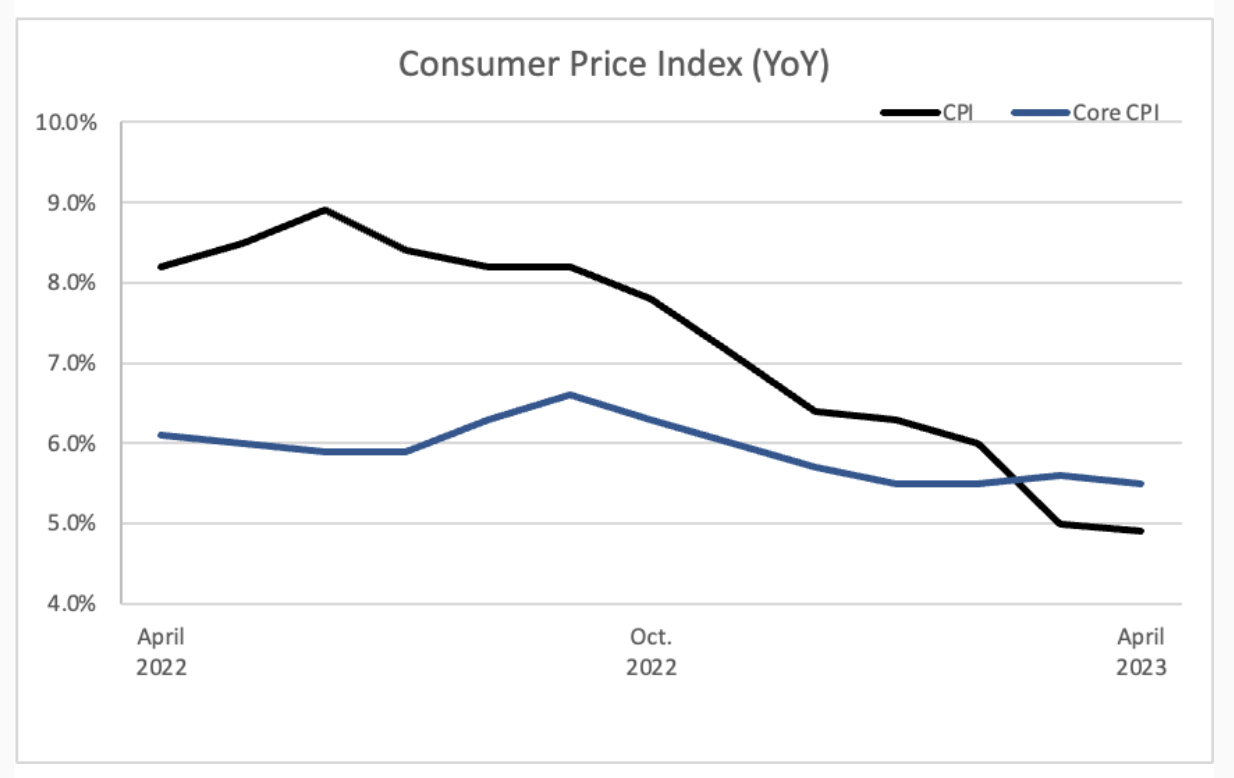
April’s Consumer Price Index inflation was reported at +4.9%, with Core CPI at +5.5%, each down a nominal 10 basis points from March’s +5.0% CPI and +5.6% Core CPI. Although this annual inflation rate is moving in the right direction, this smaller move down in April is hardly impactful compared to the monthly drop in CPI from +6% to +5% we saw in March.
Month over month, CPI came in hotter than expected at +0.4%, while Core CPI came in as expected, also at +0.4%. In both cases, this much of a monthly increase in prices is not ideal for economic stability or for the consumer.
Driving the Consumer Price Index higher were the categories of food at home (+7.1% YoY), food away from home (+8.6% YoY), electricity (+8.4% YoY), shelter (+8.1% YoY), and transportation services (+11.0% YoY). On the other hand, driving the CPI lower were the categories of gasoline (-12.2% YoY), fuel oil (-20.2% YoY), gas service (-2.2% YoY), and used vehicles (-6.6% YoY).
Categories that drove CPI lower were highly concentrated in situations where supply and demand imbalances are being worked out as unnaturally high prices settle down, specifically in gas and used cars, where the Ukraine-Russia conflict and Covid-related supply chain issues are no longer impacting supply as shockingly.
PPI
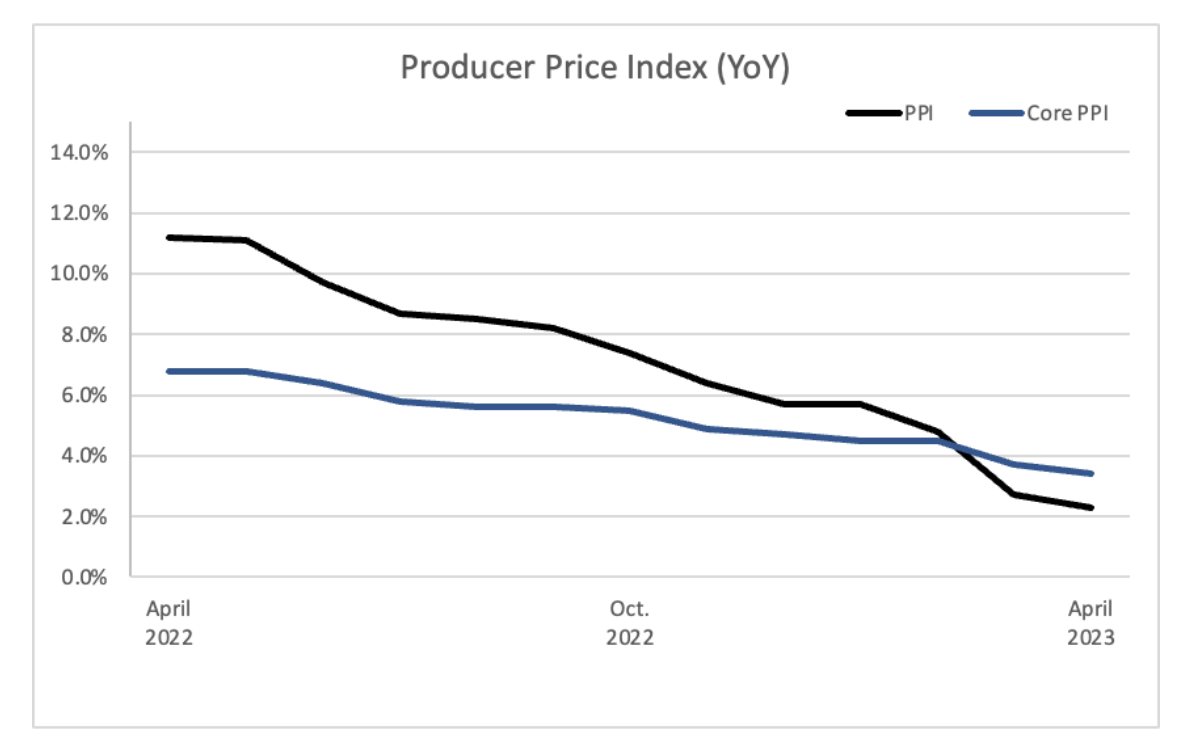
April PPI came in lower at +2.3% and Core PPI at +3.4%, both of which are down substantially from March’s +2.7% PPI and +3.7% Core PPI. On a monthly basis, PPI came down faster than expected at +0.2%, while Core PPI came in as expected at the same monthly rate of +0.2%.
Behind this data, lower food costs (-0.5% MoM) and lower transportation and warehousing expenses (-1.7% MoM) drove the PPI figures lower, while higher energy costs (+0.8% MoM) and higher trade costs (+0.5% MoM) pulled the inflation rate higher.
Overall, PPI tends to be a leading indicator of inflation, so despite the fact that consumers are feeling higher inflationary pressures still, producers are not feeling this same pressure, which they hopefully can pass on to consumers in the coming months.
PCE
Reported towards the end of May, the April Personal Consumption Expenditure inflation rate rang in higher than expected at annual rates of +4.4% for headline PCE and +4.7% for Core PCE. This ticked up slightly from March’s 4.2% PCE and 4.6% Core PCE inflation rates, with a month over month increase of +0.5% in PCE and +0.4% in Core PCE.
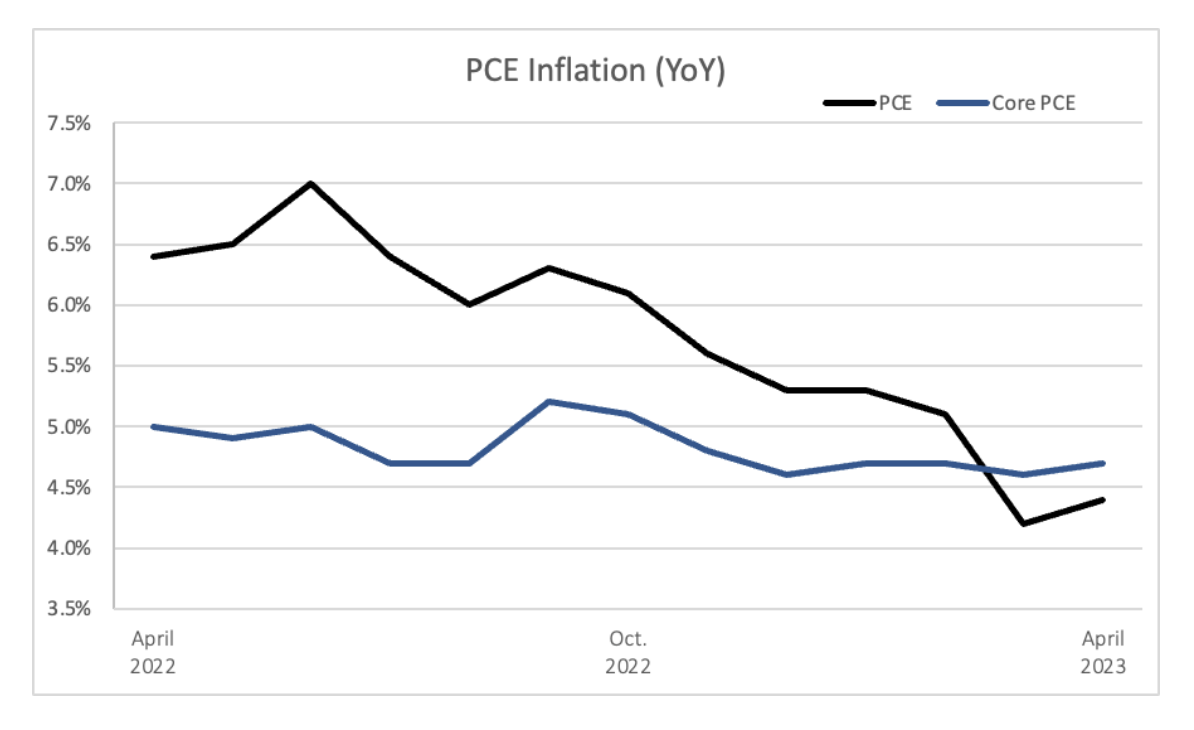
Again, PCE is the inflation rate that the Federal Reserve favors and monitors most closely, so a surprise to the upside in this data point will likely hold ramifications for the conversations and policy decisions at the Fed. With PCE inflation 2.2x their 2% target goal, another rate hike is likely and the Fed will likely continue their other forms of quantitative tightening as well.
As of May 31st, according to the CME Group, probabilities for a 0.25% Fed Funds rate hike in the June 14 meeting are up to 71%, as inflation proves to be stickier than expected, particularly in the PCE measure that the Fed cares so deeply about.
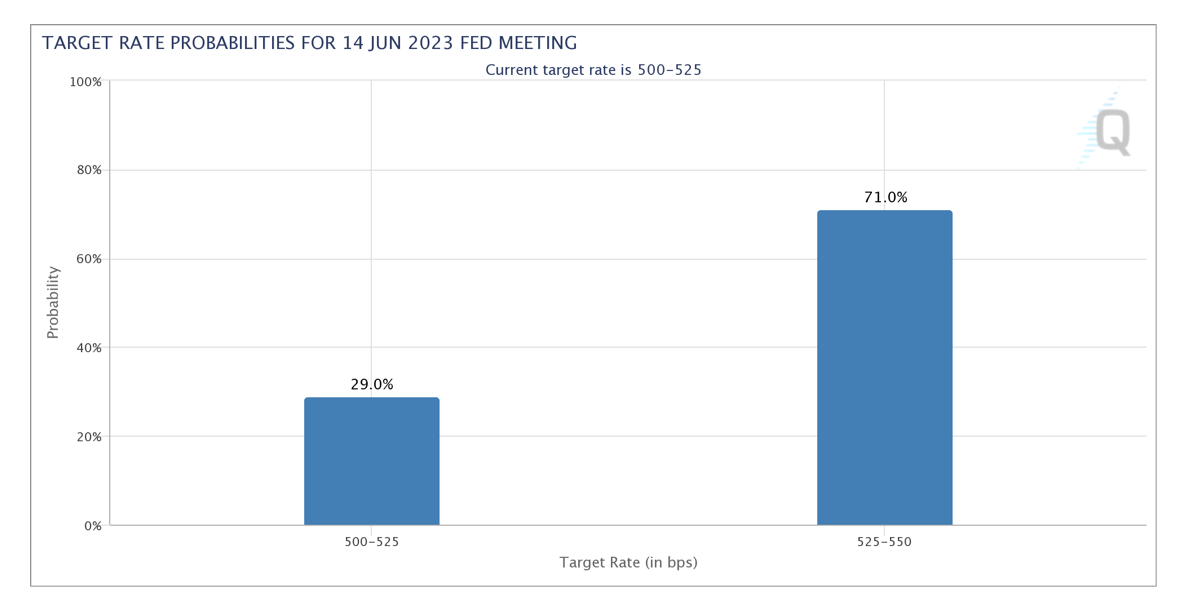
Beyond May’s data, we are watching a key employment report on June 2nd, a CPI report on June 13, and a PPI report on June 14 will all roll out just prior to the Fed’s June meeting and monetary policy decision.
We hope this stickier month of inflation data from April is more of an outlier and less of a trend, and we are hopeful inflation comes down as the lagging effects of higher interest rates ripple throughout the economy. If inflation does not calm down as quickly as we, the Fed, and many other market participants hope, we will monitor data closely and manage portfolios appropriately.
As always the team is consistently monitoring economic data as it rolls out to best manage each of our portfolios as our mandates require
Thank you for your trust.
Joseph M. Maas,
CFA, CFP®, ChFC, CLU®, MSFS, CCIM, CVA, ABAR, CM&AA
SERVICES WE OFFER RELATED TO THIS TOPIC
The information contained in this post is for general use and educational purposes only. However, we do offer specific services to our clients to help them implement the strategies mentioned above. For specific information and to determine if these services may be a good fit for you, please select any of the services listed below.
The 4x4 Financial Independence Plan ℠
Asset Protection
Retirement Planning
Tax Planning
Coaching and Consulting
EP 0012. The Three Generations of Annuities
The Financial Independence Now Podcast Hosted by Randy LuebkeIn Episode 12 of the Financial Independence Now podcast,...
11 Financial Tips to Make Caregiving Easier
Tax Planning Caregivers generally tend to their elderly/ disabled family members as a labor of love, but it can also...
EP 0011. Budgeting for Dummies
The Financial Independence Now Podcast Hosted by Randy LuebkeIn this episode of Financial Independence Now, host Randy...
Investment Advisory Services are offered through Lifetime Financial, Inc., a Registered Investment Advisory. Insurance and other financial products and services are offered through Lifetime Paradigm, Inc. or Lifetime Paradigm Insurance Services. Neither Lifetime Financial, Inc. nor Lifetime Paradigm, Inc., or its associates and subsidiaries provide any specific tax or legal advice. Only guidance is provided in these areas. For specific recommendations please consult with a qualified, licensed Advisor. Past performance is no guarantee of future results. Your results can and will vary. Investments are subject to risk, including market and interest rate fluctuations. Investors can and do lose money and, unless otherwise noted, they are not guaranteed. Information provided is for educational purposes only and is not intended for the sale or purchase of any specific securities product, service or investment strategy. BE SURE TO FIRST CONSULT WITH A QUALIFIED FINANCIAL ADVISER, TAX PROFESSIONAL, OR ATTORNEY BEFORE IMPLEMENTING ANY STRATEGY OR RECOMMENDATION DISCUSSED HEREIN.
This message is intended for the use of the individual or entity to which it is addressed and may contain information that is privileged, confidential and exempt from disclosure under applicable law. If you are not the intended recipient, any dissemination, distribution or copying of this communication is strictly prohibited. If you think you have received this communication in error, please notify us immediately by reply e-mail or by telephone (800) 810-1736 and delete the original message.
This notice is required by IRS Circular 230, which regulates written communications about federal tax matters between tax advisors and their clients. To the extent the preceding correspondence and/or any attachment is a written tax advice communication, it is not a full "covered opinion." Accordingly, this advice is not intended and cannot be used for the purpose of avoiding penalties that may be imposed by the IRS.


